How AI SRE Reduces MTTR in Distributed Systems

Engineering teams today have more dashboards, alerts, and telemetry than ever before. Yet mean time to remediate or mean time to resolve (MTTR) incidents in distributed systems is not falling. The gap is structural: monitoring shows what broke, but not why. And investigation, the work of connecting cause and effect across sprawling microservices, is where incident time actually goes. An AI SRE is an agentic system that performs site reliability work autonomously (triaging alerts, finding root cause, and driving fixes) so teams recover faster and stop drowning in data while starving for answers. This article explains what MTTR is, why it stays high in distributed systems, and the mechanism by which an AI SRE that reasons causally can finally compress it.
Book a Demo to see how causal reasoning, not correlation, cuts incident investigation time.
What is MTTR (Mean Time to Resolve)?
MTTR (mean time to resolve or mean time to remediation) is the average time it takes to fully restore service after a failure. It is calculated by dividing total downtime by the number of incidents: MTTR = Total Downtime ÷ Number of Incidents. For example, if your team experiences 10 incidents in a month totaling 5 hours of downtime, your MTTR is 30 minutes.
MTTR is the primary metric for evaluating incident response effectiveness. According to Google's SRE Book, reliability is a function of both mean time to failure (MTTF) and mean time to resolve (MTTR). The most relevant metric for emergency response is how quickly the team can restore health.
Several related metrics neighbor MTTR:
- MTTD (Mean Time to Detect). The average time from when an issue begins to when the team becomes aware of it.
- MTTA (Mean Time to Acknowledge). The average time from detection to when someone takes ownership.
- MTBF (Mean Time Between Failures). The average time between consecutive incidents.
Improving MTTR directly improves overall system reliability and reduces the business impact of every incident.
Why Does MTTR Stay High in Distributed Systems?
Distributed systems create a uniquely difficult environment for incident investigation. The problem is not a lack of data. It is that modern architectures generate so much correlated data that finding the actual cause requires reasoning across dependencies, changes, and signals that span dozens of services. Let's break down the three structural drivers.
The Systems Got More Complex
Cloud-native adoption is now the norm. According to the CNCF 2024 Annual Survey, 89% of organizations have adopted cloud-native techniques, 91% use containers in production, and Kubernetes production use reached 80% (up from 66% in 2023). The average organization now runs approximately 2,341 containers.
This scale creates challenges. The same CNCF survey found that monitoring (36%) and complexity (35%) remain significant challenges for container deployments. More moving parts mean more dependencies. More dependencies mean more potential failure points, each of which must be investigated when something breaks.
The practical effect is that a single incident may involve dozens of services, each with its own logs, metrics, and spans. An engineer responding to an alert cannot simply look at one dashboard. They must reconstruct a failure chain across potentially hundreds of nodes.
Change is the Top Trigger
Most production outages are not caused by hardware failures or external attacks. According to Google SRE research, roughly 70% of outages are due to changes in a live system: a config push, a code deploy, a scaling event. Investigation therefore starts with a question that spans the dependency graph: what changed, and what did it break downstream?
Observability Shows Correlation, Not Causation
This is the core bottleneck. Dashboards show many signals spiking at the same time. They do not say which spike caused the others. An engineer looking at a distributed system during an incident sees symptoms everywhere, but no clear line from upstream cause to downstream effect.
Practitioners describe this as being "data-rich and answer-poor." Context lives across multiple tools. The investigation loop is a manual scavenger hunt: alert fires, open the first dashboard, note the timestamp, hunt through logs, search code, and repeat. That loop consumes most of MTTR.
Google SRE doctrine is explicit here: "Humans add latency." In Google's experience, structured playbooks produce roughly a 3× improvement in MTTR compared to improvising. But playbooks assume you already know where to look. When the causation is unclear, humans become the integration layer, stitching together signals from disconnected tools while the clock runs.
This is the fundamental mismatch. Observability tools are excellent at showing that something is wrong. They detect anomalies, visualize metrics, and fire alerts. But they cannot explain why. And in a distributed system, where a single upstream change can cascade through many downstream services, the why is exactly what you need to fix the problem.
What Does High MTTR Cost Enterprises?
The business cost of incident response is not abstract. Every minute spent in the investigation phase is time the system is degraded and revenue, reputation, or safety is at risk.
- Direct hourly cost. According to ITIC's 2024 Hourly Cost of Downtime Report, a single hour of downtime exceeds $300,000 for over 90% of mid-size and large enterprises. These figures exclude litigation and regulatory penalties.
- High-impact verticals. For top verticals (including banking and finance, healthcare, government, manufacturing, retail, and transportation), average hourly outage costs exceed $5 million, according to ITIC 2024.
- Major outages escalate fast. The Uptime Institute's Annual Outage Analysis 2024 found that 54% of significant outages cost more than $100,000, and 16% exceeded $1 million.
Every investment in reducing MTTR pays back at these rates. And since investigation, not remediation, is where time concentrates, the highest-leverage target is compressing the time between "something is wrong" and "we know why."
Book a Demo to see how cutting investigation time translates directly into recovered revenue and reduced engineering toil.
What Is an AI SRE?
An AI SRE is software that performs site reliability work autonomously. It triages alerts, finds root cause, and drives or recommends fixes across the incident lifecycle, without waiting for a human to stitch together dashboards and logs. Where a human engineer might spend an hour hunting through multiple systems, an AI SRE operates across the entire environment simultaneously.
This is different from traditional AIOps. AIOps platforms use machine learning to correlate alerts and surface patterns for a human analyst. They reduce noise, but they still require a human to reason about what those patterns mean. Runbook automation is even narrower: it runs fixed scripts when predefined conditions are met. Neither approach models the underlying system well enough to explain why something broke.
The structural gap is that these earlier tools were built to surface signals to humans, not to establish causation. In a distributed system, where a failure in one service cascades across many others, this gap is fatal to MTTR. You cannot automate diagnosis if your tooling cannot model cause and effect.
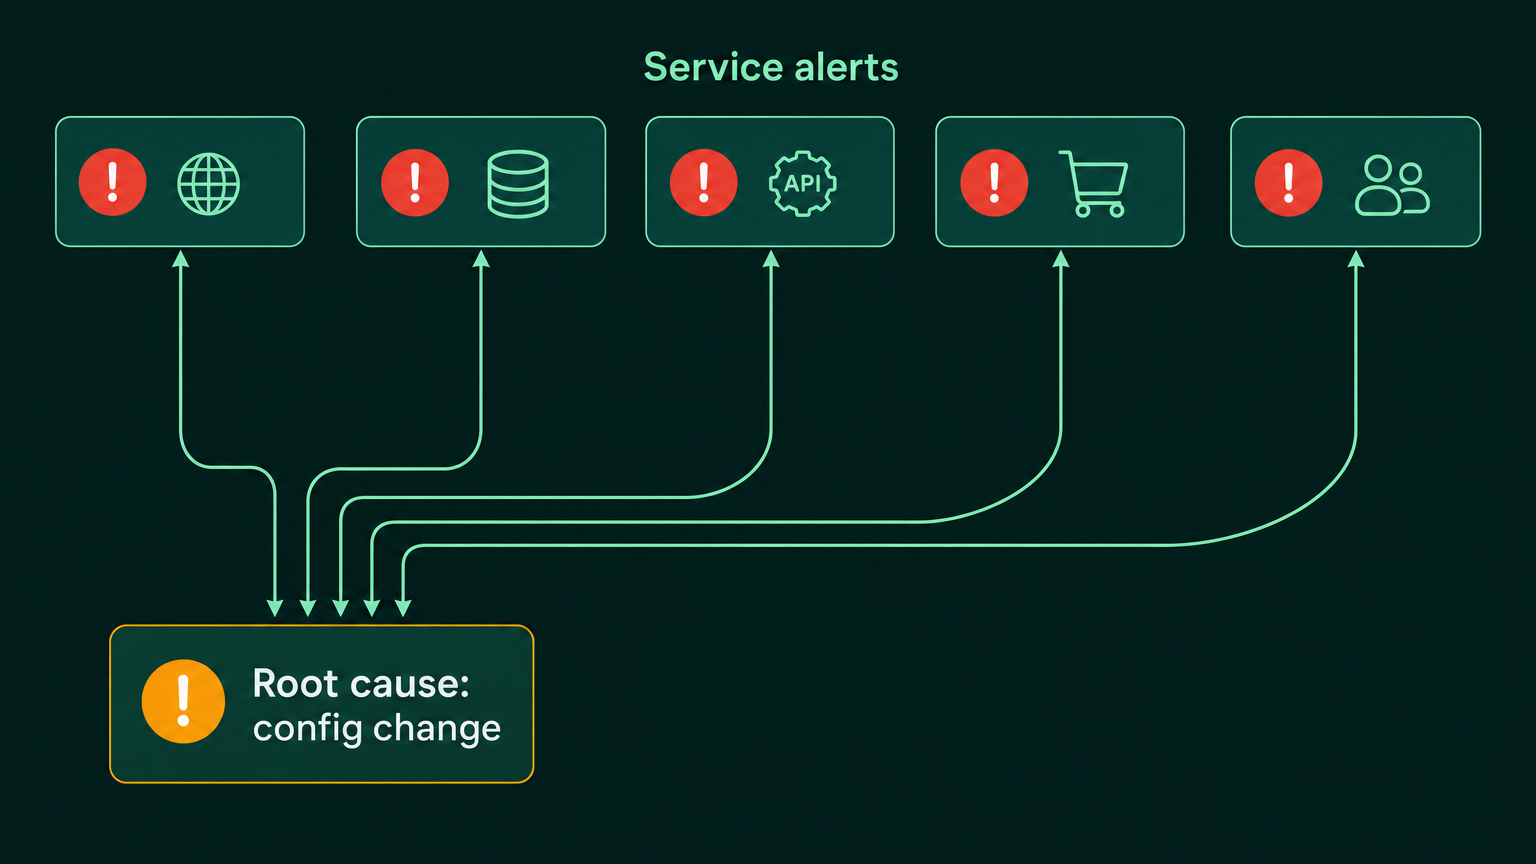
The difference matters most during complex incidents. When a config push in one service breaks authentication, which breaks checkout, which spikes error rates in payments, a correlation-based tool shows you three problems at once. An AI SRE that reasons causally identifies the single config push as the root cause and recommends the rollback immediately.
How Does an AI SRE Reduce MTTR?
The incident lifecycle has five phases: detect, triage, diagnose, remediate, and learn. Each phase is a potential source of delay. But diagnosis (finding root cause) is where the biggest MTTR gains are available, because it is where humans add the most latency. A causal AI SRE compresses each phase, with the most dramatic impact on diagnosis.
It Cuts Alert Noise and Triages Automatically
Alert fatigue is endemic in distributed systems. When a service degrades, every downstream dependency fires its own alert. The result is an alert storm, sometimes 50 or more pages in a site-wide incident. Engineers describe this as "death by a thousand cuts," where the sheer volume of notifications desensitizes responders and makes real problems harder to spot.
An AI SRE groups related alerts, suppresses noise, and surfaces the few signals that matter. This directly attacks MTTA and prevents responders from wasting time on symptoms instead of causes. Instead of paging the on-call engineer 50 times, the system presents one consolidated incident with context already attached.
It Finds Root Cause by Reasoning About Causation
This is the critical step. Instead of correlating spikes, a causal AI SRE models cause and effect across the dependency graph. It asks which change or failure could have produced the observed downstream effects, and reasons backward through the system until it reaches the true root cause.
This is where the correlation-versus-causation distinction becomes operational. Correlation-based tools show you many things happening at once. Causal tools follow the chain of events from origin to outcome. The difference is the difference between showing you a dashboard of red alerts and handing you the specific config change, in the specific service, that triggered the cascade.
It Drives or Recommends Remediation
Once root cause is known, an AI SRE can recommend or execute the fix. For safe, repeatable issues, it drives self-healing (auto-scaling, rollback, config correction). For novel or higher-risk issues, it presents evidence-backed recommendations for a human to approve.
Key point: Practitioners are rightly skeptical of autonomous remediation. The safest approach is human-in-the-loop for production changes, with the AI handling investigation and fix recommendation.
It Feeds Learnings Back to Prevent Repeats
The final phase of the incident lifecycle is learn. A strong AI SRE captures production context and returns it to development, so the same class of incident does not recur. This closes the loop and reduces future incident volume, not just speed of response.
This learning loop is where long-term MTTR improvement happens. Each incident that teaches the system to recognize a new failure pattern reduces the likelihood that a human will need to investigate that pattern again. Over time, the team spends less time on repeated issues and more time on novel problems.
Book a Demo to put an AI SRE that explains why, not just what, to work on your production systems.
FAQ
MTTR (mean time to resolve or mean time to remediation) is the average time to fully restore service after a failure. It is calculated as total downtime divided by the number of incidents, MTTR = Total Downtime ÷ Number of Incidents.
MTTR stays high because monitoring shows what broke but not why, and investigations must connect cause and effect across many services. Distributed architectures also create complexity, outages are often triggered by changes, and observability exposes correlated symptoms without identifying causation.
The article identifies three structural drivers: increased system complexity, change being a top trigger for outages, and observability showing correlation instead of causation. Together these make it hard to find the true root cause across dependencies.
An AI SRE is software that performs site reliability work autonomously by triaging alerts, finding root cause, and driving or recommending fixes across the incident lifecycle. It operates across the environment simultaneously instead of requiring a human to manually stitch together dashboards and logs.
An AI SRE reduces MTTR by cutting alert noise and triaging automatically, finding root cause through causal reasoning, and then driving or recommending remediation. It also feeds learnings back to development to prevent repeat incidents and reduce future investigation effort.