
Understand how your team uses Traversal.
See who's using Traversal, how usage is growing, and where it's coming from.
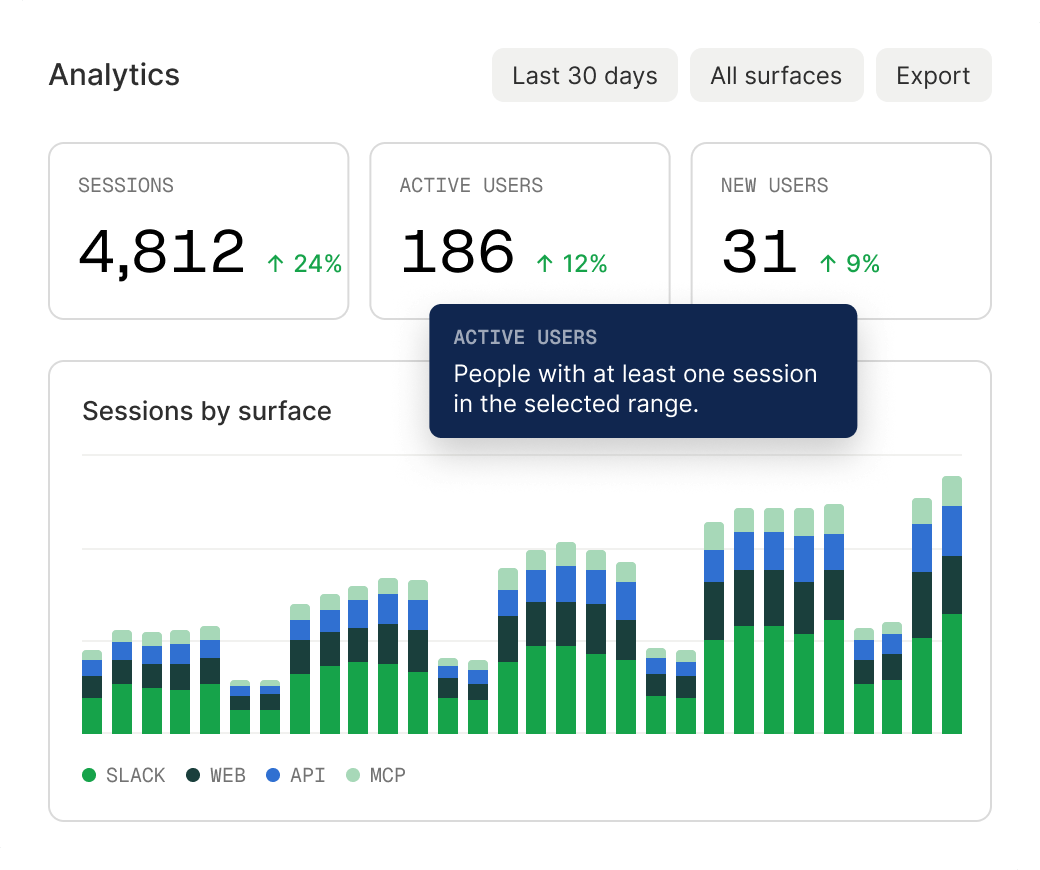
What you can see
Usage over time
Sessions and active users day by day, from the last week to the last quarter.
Adoption at a glance
Sessions, active users, sessions per user, and new users, all updating as you change the date range.
Every session, traceable
Click any number to see the sessions behind it: what was investigated, who started it, and when.
Top users and channels
Who's investigating most, and which channels Traversal is doing the most work in.
Your investigators
Everyone using Traversal at a glance, with new adopters and active streaks called out.
Activity over time
A daily heatmap of sessions that shows your team's weekly rhythm and how it's growing.
Built to be shared

Export anything
Every chart downloads as CSV or PNG, labeled and ready for a slide.

Shareable views
Filters and date ranges live in the URL, so the view you send is the view they see.

Every metric defined
Hover any number to see exactly what it counts.

Analytics API
Pull the same metrics into your own dashboards and scorecards.