The 5 Best Tools for Reducing MTTR in 2026

The best tools for reducing MTTR in 2026 are Traversal, Dynatrace, Datadog, incident.io, and PagerDuty. Traversal shortens investigation itself, pinpointing the root cause in minutes, while Dynatrace and Datadog shorten detection and causal analysis inside their own observability platforms. Coordination is where incident.io saves time, and PagerDuty shortens paging and escalation.
MTTR (mean time to resolution) reduction tools are software that shortens one or more phases between an incident starting and service being restored. This ranking weighs how much each tool shortens the longest phase in large distributed systems. It also weighs the evidence each tool gives responders and its fit with an existing stack.
Choose by the phase that runs longest in your own incidents. In large distributed systems, Traversal's experience and practitioner reports point to investigation: working out what changed and which dependency caused the symptom. Teams that add dashboards and paging rules often see MTTR stay flat, because engineers still have to work out where to look first.
Long outages are also expensive. In Uptime's 2025 annual survey, published in the Uptime Institute outage analysis, 57% of respondents said their most recent major outage cost more than $100,000. One in five said more than $1 million, and respondents are mostly data center and digital infrastructure operators reporting their own costs.
Book a demo to see how Traversal's Incident RCA shortens investigation on your incidents and gives responders an evidence-backed root cause.
Top 5 Tools for Reducing MTTR
The list is ordered by how directly each tool shortens investigation in large distributed estates. Each entry covers what the tool does, its phase, fit, strengths, and potential limitations.
1. Traversal
Traversal is an AI SRE platform for enterprise systems where root cause often sits many hops from the first alert. Its lifecycle capabilities are Alert Intelligence, Incident RCA, Self-healing, Code Resilience, and Production Support.
Its architecture was purpose-built for complex root cause analysis. Agentless Data Capture™ collects telemetry, code, and production data, and the Causal Indexer™ distills it up to 1,000:1 without signal loss. That feeds the Production World Model™, a continuously updated causal model of the environment. During an incident, the Causal Search Engine™ tests hypotheses across multi-hop dependencies, covering 10+ hops from apps to services to infrastructure to networking.
The Knowledge Bank™ automatically learns from previous incidents, and also brings runbooks, docs, and past incidents into each investigation. Together, these components let multi-hop Incident RCA return an evidence-backed root cause and a remediation path.
Across enterprise customers, Traversal averages 82%+ RCA accuracy in under five minutes. At a Fortune 100 financial services company, Traversal reached 82% RCA accuracy across in-scope applications while ingesting 250 billion logs of interest per day. That Fortune 100 financial services deployment also produced a 32% reduction in potential MTTR within in-scope applications.
At PepsiCo, Traversal autonomously triages 500,000+ alerts a month. PepsiCo's investigation time fell by 70%.
Phase it shortens: Investigation and diagnosis, plus alert triage and supported remediation.
Best for: Enterprise SRE and platform teams with large, heterogeneous, distributed systems, where investigation is the longest part of an incident.
Strengths:
- Multi-hop causal investigation: Returns an evidence-backed root cause and remediation path, even several services from the alerting one.
- Continuously updated Production World Model: Investigations start from a live causal model of current dependencies.
- Alert Intelligence: Alert Workers triage alerts autonomously before on-call engineers engage.
- Flexible deployment: Runs agentless and read-only, in the customer's cloud (BYOC) or on-premises.
Potential limitations:
- Built for enterprise scale: Smaller teams with simple architectures will see less benefit.
- Not a paging tool: Teams whose main gap is on-call scheduling or escalation policy still need a paging tool alongside it.
2. Dynatrace
Dynatrace is an observability platform whose AI layer, Dynatrace Intelligence, combines deterministic causal AI with agentic AI, according to the vendor. It runs on the Grail data lakehouse and the Smartscape® real-time dependency graph. The platform also includes Dynatrace Assist and built-in SRE and Developer agents.
Phase it shortens: Detection and root cause analysis inside the Dynatrace estate, plus supervised remediation.
Best for: Large enterprises already running Dynatrace broadly that want topology-aware RCA and supervised automation in the same platform.
Strengths:
- Topology-aware RCA: Deterministic root cause analysis that Dynatrace prioritizes by customer impact.
- Anomaly detection: Built-in detection surfaces abnormal behavior across the monitored estate.
- Guardrailed agentic remediation: Workflows act on answers from deterministic AI, with guardrails.
- No per-seat fees: Pricing has no per-seat fees or user tiers.
Potential limitations:
- Data scope: Analysis depends on data in Grail and Smartscape®, so coverage follows the reach of Dynatrace's own data layer.
- Spend commitment: Dynatrace requires a minimum annual platform spend commitment.
- Metered agentic work: Agentic investigations run through workflows, MCP, or the API are metered in AI units.
3. Datadog
Datadog is an observability platform with Watchdog™ anomaly detection and Bits Investigation, formerly Bits AI SRE. Datadog says Bits Investigation investigates alerts automatically as they fire. Its Incident Management unifies monitoring, paging, incident response, and postmortems.
Phase it shortens: Detection, investigation of alerts on Datadog telemetry, and coordination for teams that run incidents in Datadog.
Best for: Teams standardized on Datadog telemetry that want AI investigation and incident response in one platform.
Strengths:
- Autonomous alert investigation: Responders do not have to start each alert investigation by hand.
- Zero-setup Watchdog RCA: Watchdog RCA needs no manual setup in Infrastructure Monitoring and APM.
- Alert-to-postmortem workflow: One product covers the path from first alert to postmortem.
Potential limitations:
- Datadog-centered data: Investigation works from the telemetry Datadog collects, the scope the product was built around.
- Layered pricing: AI usage is metered in AI credits on top of per-host and per-seat pricing.
- Government site gap: Bits Investigation is not supported on Datadog's US government sites.
4. incident.io
The incident.io platform covers On-call, Response in Slack or Teams, Status Pages, Scribe, and post-mortems. Its AI SRE product, Investigations, runs on incident.io's Nexus model. According to incident.io, Investigations starts when an incident is declared and links every hypothesis to its sources.
Phase it shortens: Coordination (roles, comms, status updates, and owner lookups), with investigation added on top.
Best for: Slack- or Teams-centric engineering teams that want on-call, response, status pages, and AI investigation in one tool.
Strengths:
- Chat-native workflow: Responders declare, run, and close incidents inside Slack or Teams.
- Built-in status pages: The incident workflow prompts responders to post status updates.
- AI alert grouping: On-call groups related alerts to reduce noise for the team.
- Sourced hypotheses: Investigations links each hypothesis back to its sources.
Potential limitations:
- Add-on RCA: Root cause analysis is a paid add-on available only on Pro and Enterprise plans.
- Per-user pricing: Plans are priced per user, and On-call is billed separately.
- Incident-triggered investigation: Investigations starts from incidents declared and run inside incident.io.
5. PagerDuty
The PagerDuty Operations Cloud handles on-call scheduling, paging, and escalation. PagerDuty AIOps reduces alert noise, and PagerDuty Advance adds AI agents, including Scribe Agent for incident calls and channels. PagerDuty describes its SRE Agent as triaging, diagnosing, and remediating as a virtual responder with human approval.
Phase it shortens: Time to acknowledge and mobilize, plus alert noise before humans engage. Its core design centers on getting the right responder engaged.
Best for: Organizations that need enterprise-grade paging and escalation across many monitoring tools.
Strengths:
- Escalation maturity: Schedules, escalation policies, and paging are built for large on-call organizations.
- Broad integrations: 750+ native integrations connect PagerDuty to most monitoring stacks.
- AIOps noise reduction: AIOps reduces alert noise before responders are paged.
- Agentic responder features: The SRE Agent triages, diagnoses, and runs remediation steps with human approval.
Potential limitations:
- Per-user pricing: Every user added to the account is a paid user.
- Add-on AI: AIOps and PagerDuty Advance are sold as separate add-ons, and some agent capabilities require AIOps.
Quick Comparison of MTTR Reduction Tools
The table matches each tool to the incident phase it shortens most, with one sourced strength and limitation.
RankPlatformBest forIncident phase it shortens mostRelevant strength1TraversalEnterprises with large distributed systemsInvestigation and diagnosisMulti-hop causal investigation across 10+ hops2DynatraceExisting Dynatrace estatesDetection and RCA within the Dynatrace estateDeterministic, topology-aware RCA3DatadogDatadog-standardized teamsDetection and alert investigation on Datadog dataInvestigation starts as alerts fire4incident.ioChat-centric teamsCoordination in chatChat-native response with built-in status pages5PagerDutyPaging across many monitoring toolsAcknowledgment and mobilizationMature escalation with 750+ integrations
Where Does Incident Time Actually Go?
In large distributed systems, most incident time usually goes to investigation: working out what changed, which dependency caused the symptom, and who owns it. Once the cause is known, the fix is usually the shorter step. This is Traversal's experience and what practitioners report, not an industry statistic.
Our breakdown of why diagnosis takes so long splits an incident into five phases. Each has a different actor:
- Detection: A monitoring system notices abnormal behavior and sends an alert.
- Acknowledgment and triage: The on-call engineer acknowledges the page, assesses severity, and decides whether to declare an incident.
- Investigation and diagnosis: Responders form hypotheses, check them against telemetry and recent changes, and identify the cause.
- Mitigation and remediation: The owning team rolls back, fails over, or changes config to stop impact, then ships a lasting fix.
- Verification: Responders confirm recovery in metrics and customer-facing signals.
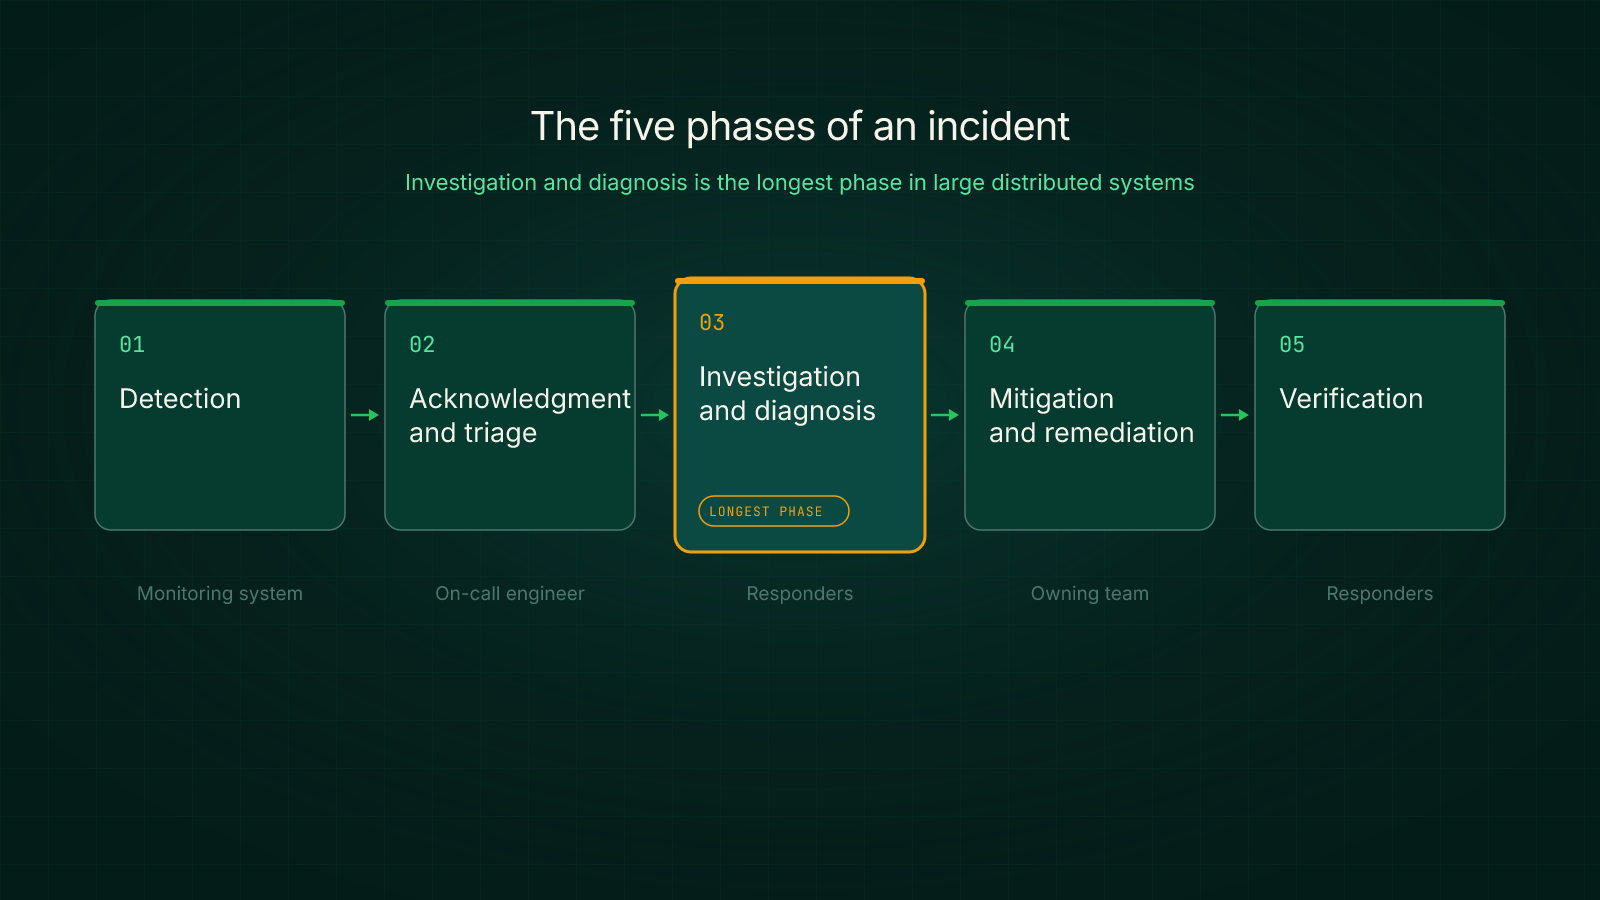
Five incident phases from detection to verification, with investigation and diagnosis highlighted as the longest phase
Escalation can happen in any phase, when the on-call engineer pulls in another team or a senior responder. It adds people but does not, by itself, produce a diagnosis.
Engineers describe phase three consistently: figuring out where to look first, ruling out theories, and hunting for service owners. They also switch constantly between paging, chat, code, and observability tools.
In DigitalOcean's Traversal deployment, root cause for one incident was found in 11 minutes, and the fix shipped in 28 minutes. That work would otherwise have taken 10 to 15 engineers more than an hour.
How to Evaluate Tools for Reducing MTTR
Five criteria show whether a tool will shorten your longest phase. The first uses your own incident data.
1. Measure which phase is longest in your own incidents. Pull timestamps from recent high-severity incidents and find the largest gap. Slow acknowledgment means paging is the bottleneck; a long gap between acknowledgment and mitigation means investigation is.
2. Check multi-hop investigation depth and checkable evidence. A useful investigation tool names what it ruled out and which signals support its conclusion. It should follow dependencies across services, infrastructure, and networking instead of stopping at the alerting service.
Some teams try to build this capability by connecting a frontier model to observability tools through MCP (Model Context Protocol). Traversal's AI SRE benchmark on Sev-1 incidents tested that approach on 25 real Sev-1 to Sev-3 incidents at a large financial services enterprise. Traversal was judged the better RCA 83% of the time against the strongest frontier-model-plus-MCP setup, at 9.5 minutes of average latency.
3. Look for change awareness. The tool should connect symptoms to deploys, config changes, and dependency changes. The Google SRE book introduction reports that, in Google's experience, roughly 70% of outages are due to changes in a live system.
AI-generated change raises the stakes. In a 2025 survey of 4,867 respondents, the DORA AI-assisted development report found AI adoption improves throughput but is still associated with higher delivery instability. The finding is correlational, not proof of cause.
4. Prefer delivery in the incident channel. Traversal Workers in Slack and Teams join incident channels when an incident fires, without anyone invoking them. A copilot that a responder must open and prompt adds a step mid-incident.
5. Confirm data scope and deployment. Ask whether the tool investigates only telemetry in its own platform or across your existing tools. Check for BYOC or on-premises options and how much tuning it needs.
How Should You Measure MTTR Before and After Buying a Tool?
Measure time per incident phase and per incident class, and look at the median and the tail. A single MTTR average is too noisy to show whether a tool worked.
Google SRE's Incident Metrics in SRE report (Štěpán Davidovič, 2021) finds MTTR-style statistics poorly suited for decision making or trend analysis on production incidents. That includes judging the effect of a product purchase.
The DORA metrics history explains that MTTR was renamed and redefined in 2023 as failed deployment recovery time, scoped to change-caused failures. Check which definition your dashboard uses.
Before rollout, baseline the investigation phase on recent high-severity incidents: the gap between acknowledgment and identified cause. After rollout, compare like-for-like incident classes, such as deploy-related incidents, instead of the overall mean.
Choosing the Right Tool for Your Team
The best tools for reducing MTTR in your environment depend on which phase your measurements flag. Match the tool to that phase:
- Slow paging and escalation: Start with PagerDuty.
- Heavy coordination overhead: Choose incident.io if teams lose time to roles, updates, and owner lookups.
- One standard observability platform: Look at Dynatrace or Datadog for AI analysis inside your current platform.
- Long multi-hop investigations: Choose Traversal, which is built for investigation across large distributed estates.
These tools can run together. Traversal works alongside paging and chat tools, and Workers post findings into your existing incident channel.
A confirmed root cause does not remove the rest of the response. Teams still need owning specialists, change processes, and required approvals before a fix goes out.
Book a demo to run Traversal's Causal Search Engine™ against your own high-severity incidents and see where it shortens investigation and MTTR.
FAQ
Find the longest phase in your own incidents and shorten that one first; in large distributed systems, it is usually investigation. Reducing alert noise, giving responders evidence, and making runbooks and past incidents searchable can also help.
AI helps most when it tests hypotheses against telemetry, changes, and dependencies, then returns a root cause with supporting evidence. Summaries and alert grouping can save reading time but leave diagnosis to responders.
MTTR is the total time from incident start to service restoration divided by the number of incidents in the period. Definitions vary, so confirm whether the measurement starts at detection or impact and ends at mitigation or full recovery.
Alerting tools notify the right responder, coordination tools organize roles and updates after an incident is declared, and investigation tools determine why it happened. Many enterprise teams use one of each because they shorten different incident phases.
Traversal's benchmark of 25 real Sev-1 to Sev-3 incidents found that its RCA was judged better 83% of the time than the strongest frontier-model-plus-MCP setup. The article also reports that do-it-yourself setups ran at two to three times its latency.


What Are the Best AI SRE Tools for Financial Services? 5 Platforms Ranked for 2026

Traversal Now Sees Your AWS Stack: Introducing CloudWatch and AWS Account Integrations